EECS 663
Network Modeling and Simulation
The purpose of this project is for you to:
1) Gain experience with a commercial network-modeling tool.
2) Determine the performance of statistical multiplexers as the characteristics of the input traffic changes.
3) Gain an understanding of the relative merits of integrated communications systems.
4) Gain an understanding of blocking in circuit switched networks.
5) Gain an understanding of routing and priority queueing in packet networks.
Be sure to show in your report how you verified and validated your results.
See
http://www.ittc.ku.edu/EECS/EECS_663/report_format.html for more details on the report format. Hint: see the Extend models on the class ftp site. Do not pad your reports, all figures and tables must be discussed in the text.Part 1.
Performance of a statistical multiplexer:
a) Exponential Message Lengths
Find the average delay through a statistical multiplexer as a function of the packet arrival rate.
Assume:
a) Average message length is 10000 bits
b) The message lengths are exponentially distributed
c) A Poisson arrival process
d) A link capacity of 10 Mb/s
b) Fixed Message Lengths
Find the average delay through a statistical multiplexer as a function of the packet arrival rate.
Assume:
a) Message length is 10000 bits
b) The message lengths are constant
c) A Poisson arrival process
d) A link capacity of 10 Mb/s
Compare the performance of a statistical multiplexer with random (in this case exponentially distributed) and fixed message lengths.
c) Multiple Classes of Message Length Characteristics
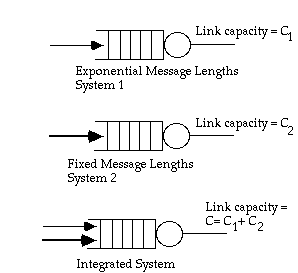
The above cases represent the segregation of traffic by class, that is, a separate statistical multiplexer is used for packets with like characteristics. However, can integrating the traffic and using one statistical multiplexer result in better performance? Figure 1 presents the models for the segregated and integrated systems. The performance metric used here is average delay.
Figure 1
Models for the Integrated and Segregated Systems
To enable a fair comparison between the integrated and segregated cases, the allocation of the total capacity, C, to Systems 1 and 2 must be optimized. That is, C1 and C2 must be selected such that:
C= C1 + C2
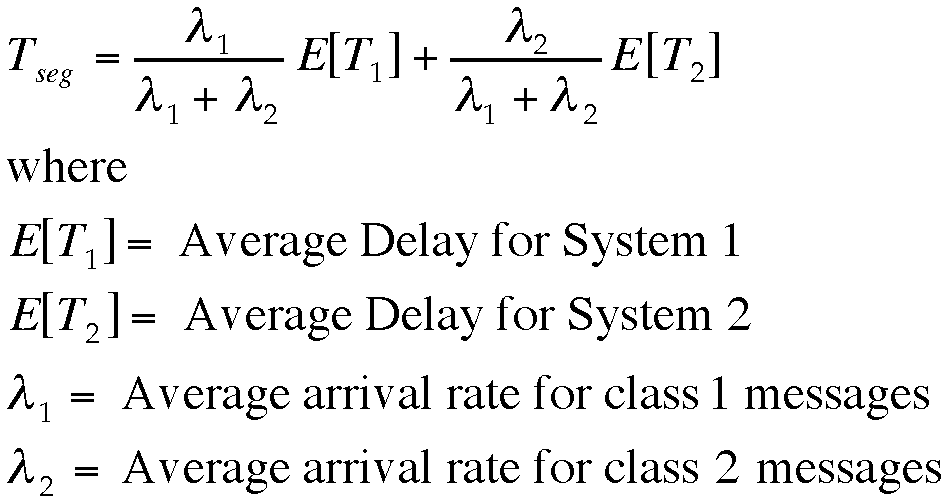
and weighted average delay, Tseg is minimized,
Assume
C = 10 Mb/s
![]() 500
500
![]() 2000
2000
L1 = Average message length for class 1 = 10000 bits
L2 = Average message length for class 2 = 500 bits
i) Find the optimum values for C1 and C2.
ii) Compare the performance of the integrated and segregated systems in this case.
iii) Repeat the comparison for the following cases:
![]() 600
600
![]() 600
600
L1 = Average message length for class 1 = 5000 bits
L2 = Message length for class 2 = 5000 bits
and
![]() 2000
2000
![]() 500
500
L1 = Average message length for class 1 = 500 bits
L2 = Message length for class 2 = 10000 bits
Part 2.
Performance of a circuit switch.
Build a simulation model of a circuit switch with 9 output lines.
Assume the average holding time is 3 min.
Part 3.
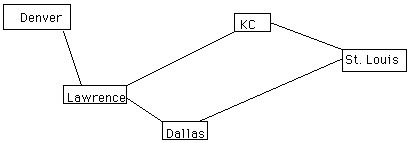
The purpose of this part of the project is to routing and priority queueing performance in mesh networks, specifically for the network shown below. Here consider that there is a router at each location. A purpose of this study is to determine the potential of using priority queueing to provide Class-of-Service in the internet.
Each site has three hosts,
(UBR) Data
Assume uniformly distributed message lengths with a range of
1 to 3 Kbytes, and exponential interarrival times with an average of 3 ms,
(VBR) Variable bit rate video
Assume exponential message lengths with an average of 20 Kbytes
and fixed interarrival times of 10 ms
(CBR) Fixed rate
Assume fixed length messages, 50 bytes and fixed interarrival times of 0.25 ms
Routing Table
Denver - Lawrence - KC - St. Louis
Lawrence - Dallas - St. Louis
Denver - Lawrence - KC
Denver - Lawrence - Dallas
Traffic Matrix
|
Destination |
|||
|
Host Type |
|||
|
Source |
UBR |
VBR |
CBR |
|
Denver |
St. Louis |
Dallas |
Dallas |
|
Lawrence |
St. Louis |
Dallas |
Kansas City |
|
Dallas |
St. Louis |
St. Louis |
St. Louis |
|
Kansas City |
St. Louis |
St. Louis |
St. Louis |
[Read this table as: All UBR traffic from (source) Denver is destine for St. Louis. All VBR traffic from Dallas is destine for St. Louis. All CBR from Denver is destine for Dallas]
a) Assume the capacity of each link is 70 Mb/s; using simulation estimate the average end-to-end delay and the delay variance for each class of traffic. The delay measurements should be taken from the source to the destination and they should be reported by priority class.
b) Repeat the simulation in part a) assuming non preemptive priority service, with the priority order (CBR) highest priority, (VBR) next level of priority and (UBR) having the lowest priority.